Drought and climate change are important factors to include in any hydrologic analysis. Current weather-related events in California, such as the extended drought and recent multiple atmospheric rivers, demonstrate how quickly hydrologic conditions can change. A lag(1) autocorrelation analysis of California Climate Division 2 (Sacramento Drainage) using monthly Palmer Hydrologic Drought Index (PHDI) values was conducted to find data ranges, persistence of conditions, along with seasonal and historical drought patterns. Results show distinct conditions within the hydrologic-climatic system which include periods of (a) persistent drought, (b) persistent wet, (c) transition from drought to wet, and (d) transition from wet to drought. Month-to month PHDI changes are quantified using a summation infographic based on the autocorrelation scatterplot.
Key words: PHDI, drought, lag(1) autocorrelation
Background
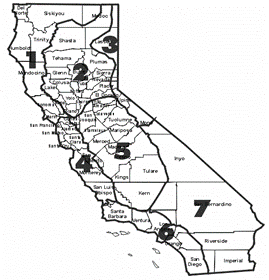
California is divided into seven climate divisions, each with various types of climate indices (Figure 1). For this study, Climate Division 2, Sacramento River drainage (NOAA, 2023a) is used as it contains the Lake Shasta reservoir, an important component of California’s water resources system.
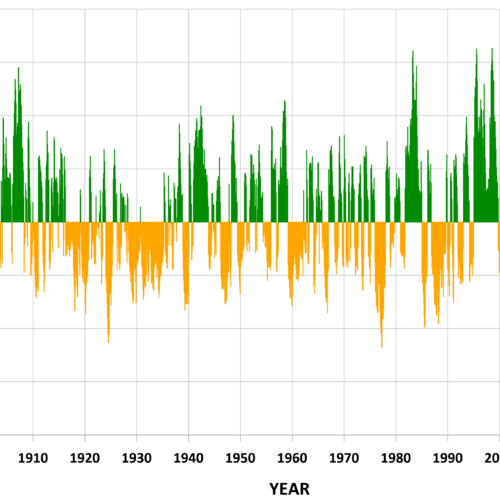
This study examined PHDI information produced by NOAA’s National Centers for Environmental Information (NCEI). The NOAA website for drought data states that the PHDI “measures hydrological impacts of drought (e.g., reservoir levels, groundwater levels, etc.) which take longer to develop and longer to recover from. This long-term drought index was developed to quantify these hydrological effects, and it responds more slowly to changing conditions than the Palmer Drought Severity Index” (NOAA, 2023b). Table 1 describes the different PHDI levels (Hayes, 2007) and Figure 2 shows the 1895 to 2023 timeline plot of this monthly data (NOAA, 2023c).
Some of the most severe drought values have occurred in recent years, with June 2021 through September 2021 all exhibiting PHDI values in the extreme drought range (-5 or more negative).
Figure 1: California Climate Divisions,
Climate Division 2, Sacramento River drainage (source: NOAA).
Table 1: PHDI level descriptions (Hayes, 2007).
Figure 2: California Climate Division 2, monthly PHDI values, 1895 to 2023 (source: NOAA).
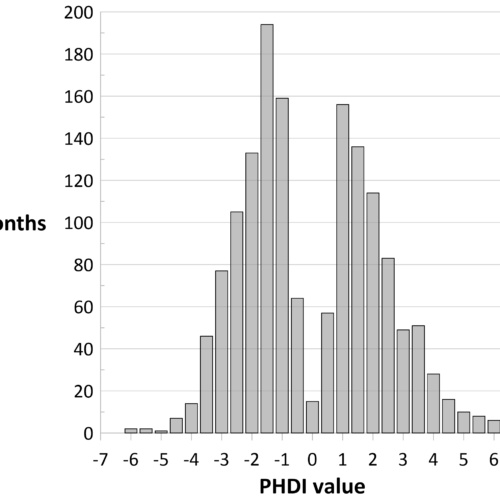
A histogram (Figure 3) shows the number of months for each PDHI value. There is a distinct bimodal distribution, with a total of 804 months of drought conditions (negative PHDI) and 661 months of wet conditions (positive PHDI). The 0 condition (near normal) represents only 15 months, indicating that this rarely occurred.
Figure 3: California Climate Division 2, PHDI histogram – months per PHDI condition.
Analysis technique
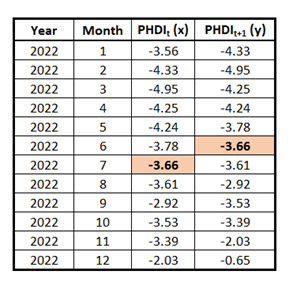
A lag (1) temporal autocorrelation scatterplot was used to examine the PHDI data. Table 2 shows the one-month data shift used to create an x-y system with PHDI at time “t” for the x coordinate, and PHDI at time “t+1” for the y coordinate.
Table 2: PHDI one-month data shift example.
Results
Extremes can be represented by large positive and large negative monthly PHDI changes, shown in the following tables (Tables 3 and 4).
Table 3: Ranked largest positive monthly PHDI changes, California Climate Division 2.
Table 4: Ranked largest negative monthly PHDI changes, California Climate Division 2.
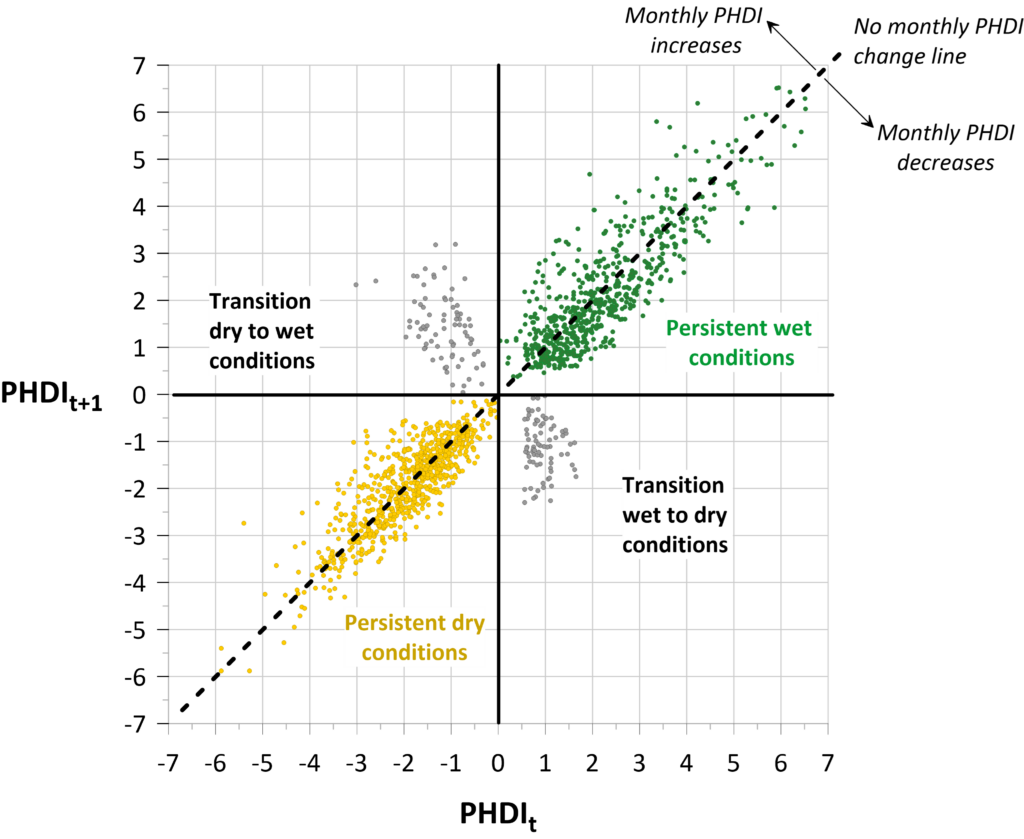
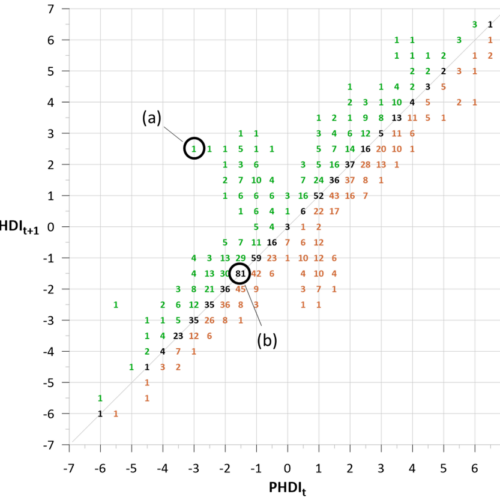
However, this simple approach provides an incomplete view of how the hydrologic-climatic system operates. A more expansive approach is to graph all monthly changes with a lag(1) autocorrelation scatterplot (Figure 4), where each point represents the monthly PHDI change.
Any point on the dashed diagonal line (y = 1x) indicates no PHDI change from month-to-month. Any point above the diagonal line signifies positive PHDI changes, while any point below the diagonal line signifies negative PHDI changes. Additionally, the overlay shows groups of points that represent four components of the hydrologic-climatic system, (a) persistent drought, (b) persistent wet, (c) transition from drought to wet, and (d) transition from wet to drought. The Table 1 description for “near normal” (-0.49 to +0.49) rarely happened, as the hydrologic system constantly oscillates between persistent drought and persistent wet conditions.
Figure 4: PHDI lag(1) autocorrelation scatterplot with four conditions.
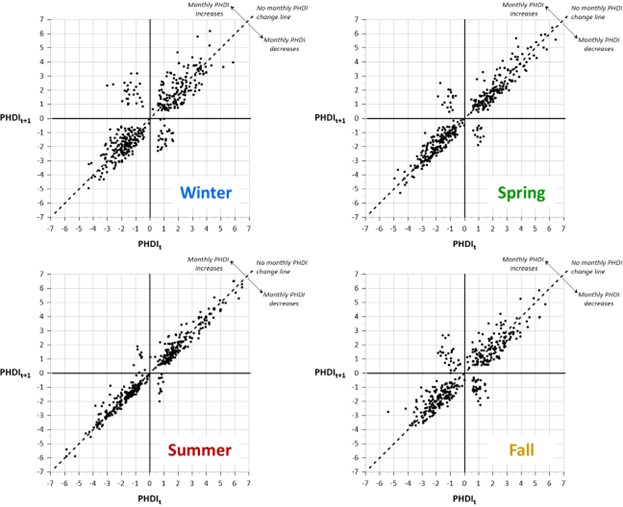
As each point can be identified by month, a breakout of seasonal scatterplots is possible as shown in Figure 5.
Spring and summer have fewer transitions. These two seasons also have less overall scatter, indicating more persistent wet and dry conditions. Interestingly, summer has both the driest and some of the wettest PHDI values. Winter and fall show more randomness, as data points are more scattered. These two seasons also have more transition points. Atmospheric rivers typically occur during winter (NASA 2023) but, with transition points seen in all four seasons, other mechanisms are likely in play.
PHDI values were rounded to the nearest 0.5 to provide a consistent way to compare all month-to-month pairings, allowing for a summation of all changes for the period of record: 1895 to 2023 (Figure 6).
The PHDI value of -3 shows the single greatest range of change, -4 to +2.5 (Figure 6a). This display helps identify the most and least common changes that have taken place. The most common value is the monthly PHDI value of -1.5 followed by -1.5, which occurred 81 times (Figure 6b). Summation values of 1 indicate unusual conditions as these specific monthly changes occurred only once in the 128-year record.
Figure 6: Historical summation of all PHDI monthly changes for California Climate Division 2:
(a) single largest change, (b) most common month-to-month occurrence.
Coordinates for count values are based on categorized PHDI values.
Conclusions
The lag(1) autocorrelation scatterplot provides a basis for additional information about climatic datasets not possible with other methods. The identification of four distinct components of the hydrologic-climatic system provides new opportunities for planning and management activities by water resource organizations. The success of this approach suggests that more research should be directed to looking into mechanisms that enable large PHDI changes.
For more information about the Lag-1 autocorrelation, please read Dr. Koehler’s previous article, titled “The Lag-12 Hydrograph – Alternate Way to Plot Streamflow Time-Series Data”, AIH Bulletin, Fall 2022.
Dr. Koehler is the CEO of Visual Data Analytics and a certified professional hydrologist with over 40-years’ experience.
Previously he was the National Hydrologic and Geospatial Sciences Training Coordinator for NOAA’s National Weather Service and is a retired NOAA Corps lieutenant commander. Assignments included navigation and operations officer for two NOAA oceanographic research ships, the Colorado Basin River Forecast Center and the Northwest River Forecast Center, where he oversaw the implementation of an operational dynamic wave model for Lower Columbia River stage forecasts. Other positions include Director of Water Resources for an Arizona consulting company and the water resources hydrologist for Cochise County, Arizona.
He is also a member of the science department faculty at Front Range Community College and is instructor for astronomy, geology, geography, GIS and geodesy courses. He is also an FAA certified professional drone operator.
He has a PhD, MS and BS in Watershed Management from the University of Arizona and an additional MS in Hydrographic Sciences from the US Naval Postgraduate School. The focus of his research are alternate methods of analyzing environmental time-series data along with associated data visualizations.
Comparison of meshless MFS and CVBEM computational methods in analysis of groundwater flow pathways
Authors:
Saleem Ali1, Sebastian Neumann1, T. V. Hromadka, II2, B. Wilkins3 Cadet, Dept Mathematical Sciences, USMA, West Point, NY1 Distinguished Professor, USMA, West Point, NY2 Columbia University3
Introduction and Methodology
Computational methods to solve groundwater contamination problems continue to be of high interest to engineers and planners, among others. An important problem is identifying the source of contamination within a cluster of candidate sources. A key question is which candidate source(s) are the actual point source of the subject contamination.
Saleem Ali is a mathematical sciences major at the United States Military Academy, who is majoring in mathematical sciences. His research experience includes the computational modeling of ideal fluid flow and studying the effects of time dilation in balloon satellite flight.
I am honored to serve the American Institute of Hydrology (AIH) in my new role as President-Elect. What a rewarding journey it has been! I have learned so much in these last three years while serving as Treasurer (2020), Director of Institute Development (2021-2022), and now as President-Elect.
As a Professional Hydrologist since 2018, I am proud to be part of our AIH community. I carry that pride in my work at the Minnesota Department of Natural Resources. A science geek, I am especially interested in hydrologic and hydraulic modeling to protect against flooding, promote better infrastructure designs that maintain natural systems stability, and evaluate best management practices in our watersheds.
It is no secret that the challenges we face today are formidable. The work we do protects communities from flooding, addresses natural system degradation, navigates pollution and cleanup, and expertly manages our dwindling resources. We now have a moral obligation to confront these challenges. Because of this, I am committed to achieving our goals: establishing high standards and transparent procedures to certify hydrologists, maintaining ethical standards to protect our natural resources, and providing education, advice, and training to the public. We will continue to reach out to our professional community to certify hydrologists and welcome you to our organization. We are especially pleased to congratulate our newest member, Rewati Niraula, who successfully completed the certification requirements as a professional hydrologist in the area of surface water.
I am fortunate to collaborate with a wonderful Board of Directors – incredible people who work tirelessly to advance our mission despite having full-time jobs and family commitments. We recently welcomed Dr. Luciana Kindl Da Cunha as our new Director of Institute Development. Dr. Cunha presented an outstanding webinar in March, titled “The Next Generation Water Resources Modeling Framework: What it is, a Proof of Concept, and How to Get Involved.” As chair of the webinar committee, Dr. Cunha will be moderating our next webinar on May 25, featuring AIH co-founder Dr. Roman Kanivetsky, on “Water Resources Sustainability: Toward a New Paradigm.” Our team is actively working to streamline and improve our processes related to membership renewal, exams, recertification, and communication. We anticipate a fruitful year ahead as we collaborate with sister organizations and participate in conferences such as the upcoming SEDHYD conference in St. Louis, Mo and the Annual AWRA Conference in Raleigh, NC.
Your engagement propels the mission of our organization. Please consider contributing to the AIH Bulletin. We ask that you contact admin@aihydrology.org to submit an article for a future issue. You can find additional information about article submissions in the email sent out on March 31 or on the AIH website.
I am truly energized about my new leadership role these next few years with AIH. As President, I want to make connections, provide synergy, and fully utilize the strong leadership qualities of our Board members and members at large. I am excited about our committees and initiatives – not only for the resulting benefits, but for the process of getting to know each one of you through your involvement. It is critical that all AIH members get involved, whether it’s helping establish the DEI scholarship, expanding our webinar series, or improving our website for AIH members and the public.
Introducing New Board Members!
Salam Murtada, President Elect 2023-2024
Salam brings a wealth of experience to this position from his two-year tenure as Director of Institute Development and one-year as Treasurer. Salam will be transitioning out of his role as Webinar Committee Chair and into the role of President Elect! Salam will be continuing to engage with members and help improve the recertification process.
Luciana Kindl da Cunha, Director of Institute Development
As Director of Institute Development, Luciana will be taking on the role of Chair of the Webinar Committee. We are very excited to see the webinar series continue to expand under the guidance of this important Committee. If you have ideas for upcoming webinars and how to improve webinar outreach, delivery and access, contact Luciana to join the Webinar Committee! Luciana will also be helping the DEI Committee establish and sustain the AIH’s first DEI Scholarship Program.
Certification as a professional hydrologist or hydrologic technician
Membership as a hydrologist-in-training or student member
Free access to our webinar series
Eligibility for annual awards
Peer and employer recognitions of professional competence in hydrology
Opportunity to contribute to AIH Committees and articles in the bulletin
Recertification Process
In addition to membership renewal, AIH members are required to recertify every five years by submitting 60 hours of Professional Development Credits (PDC). Please refer to the information regarding credits, listed in your AIH membership account. And note that AIH webinars count towards accumulating the required PDC credits. Please note that we are currently in the process of streamlining the recertification process in order to make it easier. If you have any questions regarding your ongoing certification status, please contact Kory Adams at kadams@aihydrology.org.
AIH Committees
AIH has a variety of committees and groups you can get involved in, and we are always looking for AIH members to join committees. Contact the Committee Chair/Co-Chair listed below if you’d like to join. Don’t hesitate to renew your membership today, so you can get involved with important committee work!
Committee
Description
Committee Chair
Contact
Diversity, Equity and Inclusion (DEI) Committee
Committee formed in January 2022. Currently focusing on establishing a DEI scholarship program.
As we know in our daily practice, the profession of hydrology is critical to water management. The prediction, modeling and management of extreme hydrologic events is taking center stage, across the nation and the globe, and our work is more important than ever. Thank you for your continued engagement with the American Institute of Hydrology, and keeping the profession of hydrology elevated through your work!
Greetings! This is my last President’s Message, and it comes soon after our Board of Directors convened for our AIH Annual Meeting. During the meeting, our Board of Directors reflected on accomplishments and challenges from the past year and established specific strategies and tactics to achieve goals for 2023. I’m delighted about the continued achievements of AIH during my tenure as President, and I’m excited about the next steps for the organization.
While our activities and initiatives have attracted many new members to AIH, we experienced significant challenges over the past year in maintaining our previous members through membership renewals. Many members have retired from the hydrology industry, but others either have not updated their member contact information or simply decided not to renew their membership. Critical priorities for 2023 include continued emphasis on promoting the branding of our AIH certifications, and demonstrating the benefits of certification and membership to our members.
As we wrap up 2022, I’m pleased to report that we are nearly complete with a comprehensive update to our database of examination questions for our AIH certification exams. The process established by our team was successful and the approach may be applied for continued updates to our examination questions database. We convened a team of experts during the fall to develop new examination questions. Updates will be completed prior to our next round of examinations.
AIH held two Water New Year events in Sacramento, California and St. Paul, Minnesota, where members of our AIH Board welcomed the season of maximum soil moisture recharge with current and prospective AIH members. My hope is that we continue this ritual and encourage expansion across other geographies.
We also continued to engage with the American Water Resources Association (AWRA) and other affiliate organizations to promote PH certification for hydrologists and HT certification for hydrologic technicians. After a two-year hiatus from in-person attendance, we actively participated in the AWRA 2022 Annual Conference. Our involvement in the conference is detailed in a summary provided by AIH Director for Institute Development, Salam Murtada, in this Bulletin. Additionally, led by AIH Past-President, Dr. John Nieber, AIH collaborated with AWRA to produce a special issue of the AWRA publication Water Resources IMPACT, titled “Hot Topics in Hydrology.” This special issue features articles by AIH members on a handful of current topics and on recent advances in hydrology research and professional practice. We will look to share information on how AIH members can access this great publication at a later point.
We had a wonderful year – and the next will surely be awesome under the leadership of Julé Rizzardo. Look for continued initiatives by our Board to connect our AIH community and advance AIH through promoting the benefits of certification.
Lastly, I will close through reiterating important points you have seen before:
A call to all AIH certified members, as ambassadors of AIH, to take pride and flaunt your AIH acronym. Be HIT-, HT-, and PH-proud.
Member participation is vital to AIH’s success. We are eager to engage more members in AIH activities. Please reach out to our Secretary/Membership Liaison, Jolyne Lea, at membership@aihydrology.org, to get involved.
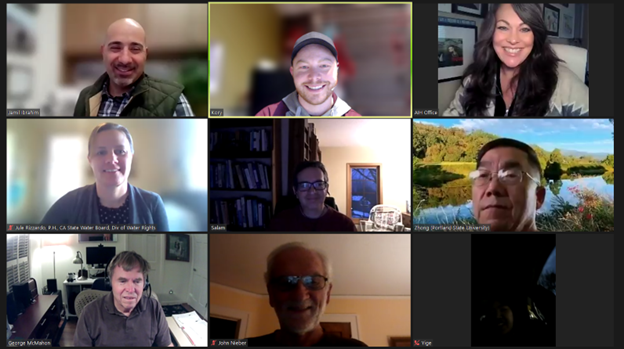
AIH’s Board of Directors (BOD) recently held its Annual Meeting virtually on December 2 and 3, 2022. The BOD reflected on accomplishments from 2022, and established goals, strategies, and tactics for 2023. Keep an eye out for some exciting items in the coming year with plenty of opportunities for active member engagement in various activities!
The American Institute of Hydrology (AIH) played an important role at the American Water Resources Association (AWRA) Annual Conference that took place in Seattle, Washington, November 7-9, 2022. Salam Murtada (Director, Institute Development) and Dr. Zhong Zhang (Director, Academic Affairs) attended the conference and represented AIH.
On the first day of the conference, AIH facilitated a climate change contest during a 30-minute engagement break. The game involved grouping participants for brainstorming ideas on select climate change-related topics. An appointed spokesperson from each group then presented their team’s ideas. The level of engagement and dedication was remarkable; they were all winners!
During a technical session, Salam provided a presentation titled Certifying the Practice of Hydrology. Salam’s presentation was an overview of AIH – its mission, purpose, structure, membership, and process for certification of hydrologists.
Salam also participated as one of the panelists for the Student and Early Career Professional Development Luncheon to advise students and professionals about their careers in hydrology and benefits of certification for hydrologists.
To promote our AIH membership and certification, AIH partnered with AWRA to offer 2022 Annual Conference attendees 50% off the membership application and examination fees. The collaboration also involved other benefits, such as featuring AIH information and items in conference materials, and e-mail blasts about AIH to all conference attendees.
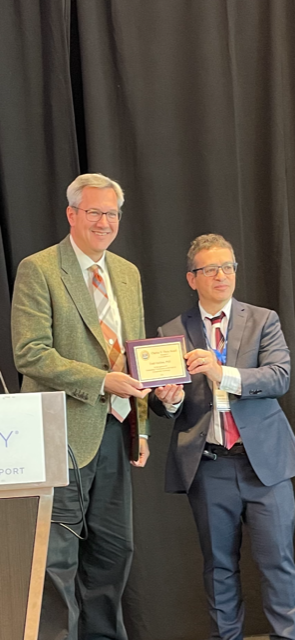
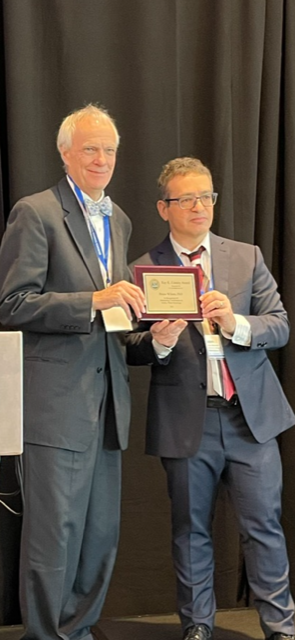
As Gold Level Sponsors of the conference, AIH was able to present the 2022 AIH Awards during the conference Awards Luncheon. The Charles V. Theis Award for Groundwater, Ray K. Linsley Award of Surface Water, and Robert G. Wetzel Award for Water Quality were issued to Dr. Todd Halihan, Dr. Bruce Wilson and Dr. Vijay P. Singh, respectively, for their outstanding contributions to the field of hydrology. Dr. Halihan and Dr. Wilson accepted their awards in-person. Dr. Singh accepted the award in absentia due to his residency overseas. The awardees offered important remarks during their acceptance speeches.
Dr. Todd Halihan, recipient of the Charles V. Theis Award for Groundwater, is a professor and Sun Company Clyde Wheeler Chair in Hydrogeology at Oklahoma State University, as well as Chief Technical Officer for Aestas, LLC. Dr. Halihan’s professional interests center in subsurface characterization using electrical hydrogeology and water supply sustainability. He has been an associate editor for Groundwater and has served as the Secretary-Treasurer of the U.S. Chapter of the International Association of Hydrogeologists. He served as the Chair of the Hydrogeology Division and the South-Central Section of the Geological Society of America. He was also the National Ground Water Association’s 2018 McEllhiney Lecturer.
“This award,” remarked Dr. Halihan, “is named after C.V. Theis who had some serious negative feedback by establishing quantitative analysis for transient well hydraulics. In my work, I have tried to advance an approach similar to the energy industry of scanning, then drilling our groundwater sites to have a more comprehensive conceptual model. The negative feedback was surprising, but I found inspiration in the way Theis managed his detractors. The lesson I learned is to find guidance from supporters who want to see the science advance and change, which inspires me far more than those detractors that seem to like the status quo.”
Dr. Bruce Wilson, recipient of the Ray K. Linsley Award for Surface Water, is a professor in the Department of Bioproducts and Biosystems Engineering at the University of Minnesota. Dr. Wilson’s research is focused on improving our understanding of hydrologic and water quality processes and erosion mechanics. Dr. Wilson has received awards from the American Society of Agricultural and Biological Engineering, Center for Transportation Studies, and the Erosion Control Association. Professor Wilson is also a recipient of the Distinguished Graduate and the Distinguished Undergraduate Teaching Awards, and the Charles E. Bowers Teaching Award. He is a Fellow of the American Society of Agricultural and Biological Engineers.
“Our survival,” remarked Dr. Wilson, “the survival of human civilization – is dependent on the wise use of our water resources. We should be proud – pat ourselves on our back – that our work is critically important. But we should also be sober because our system is so complex – complex physical, chemical, biological components, and complex interactions among them.” Dr. Wilson acknowledged his colleagues, Dr. John Nieber (AIH Past-President) and Dr. Curt Larson, his graduate school advisor who happened to be Professor Ray Linsley’s PhD student.
Dr. Vijay P. Singh (AIH Past President), recipient of the Robert G. Wetzel Award for Water Quality, is a University Distinguished Professor, a Regents Professor, and Caroline and William N. Lehrer Distinguished Chair in Water Engineering at Texas A&M University. Dr. Singh has published extensively in the areas of hydrology, groundwater, water quality, irrigation engineering, hydraulics, and water resources (more than 1470 journal articles; 35 textbooks; 85 edited reference books; 121 book chapters; and 330 conference papers). He has received more than 107 national and international awards, and three honorary doctorates. He has served as President of AIH, Chair of Watershed Council of American Society of Civil Engineers (ASCE), and President of American Academy of Water Resources Engineers (AAWRE). He has served as editor-in-chief of three journals and two book series and serves on editorial boards of more than 25 journals and three book series. Dr. Singh is an Honorary diplomat of ASCE-AAWRE, a distinguished member of ASCE, a Distinguished Fellow of AGGS, a Distinguished Honorary Member of IWRA, and an Honorary Member of AWRA.
“I am deeply humbled to receive the award for two reasons,” remarked Dr. Singh. “First, Dr. Wetzel was a giant in the water quality field, and it is a rare honor for me to have my name associated with Dr. Wetzel. Second, I have long been associated with the American Institute of Hydrology, almost since its beginning years. AIH is like my home institute inception and to be recognized by it is very special to me.” Dr. Singh acknowledged the support of his family, especially his late wife Anita, students and colleagues, among others.
The award ceremony concluded after honoring outstanding hydrologists and giving tribute to the leaders of the past, who paved the way for them to continue their important work.
Thanks to its leaders and organizers, AWRA delivered a very successful Annual Conference in 2022!
Dr. Miguel A. Medina, Jr., PH, F.ASCE (Professor Emeritus, Duke University)
Dr. Mustafa Aral, PH, F.ASCE (Professor Emeritus, Georgia Tech University)
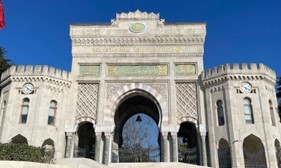
The Republic of Türkiye changed its official name from The Republic of Turkey on 26 May 2022, in a request submitted to the United Nations Secretary-General by the country’s Minister of Foreign Affairs. It was indeedunique that two former American Institute of Hydrology presidents, Dr. Miguel Medina Jr (2009-2010) and Dr. Mustafa Aral (2015-2016) presented keynote addresses in a country far away from the USA! The events unfolded at the International Water Association (IWA) 4thRegional Conference on Diffuse Pollution and Eutrophication (IWA DIPCON 2022) in Istanbul, Türkiye, held at the Istanbul University main campus, from October 24-28, 2022.
Istanbul University, founded 1453.
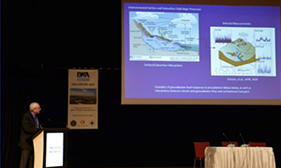
Dr. Medina illustrating interconnected surface and subsurface hydrologic processes.
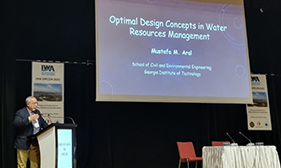
Dr. Aral reviewing design concepts and mathematical simulations.
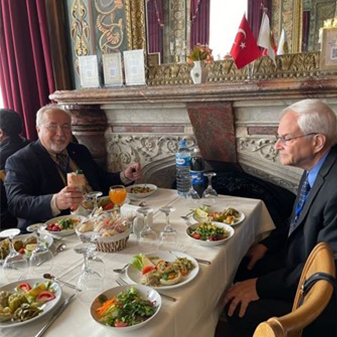
Drs. Aral and Medina enjoying a traditional Turkish meal.
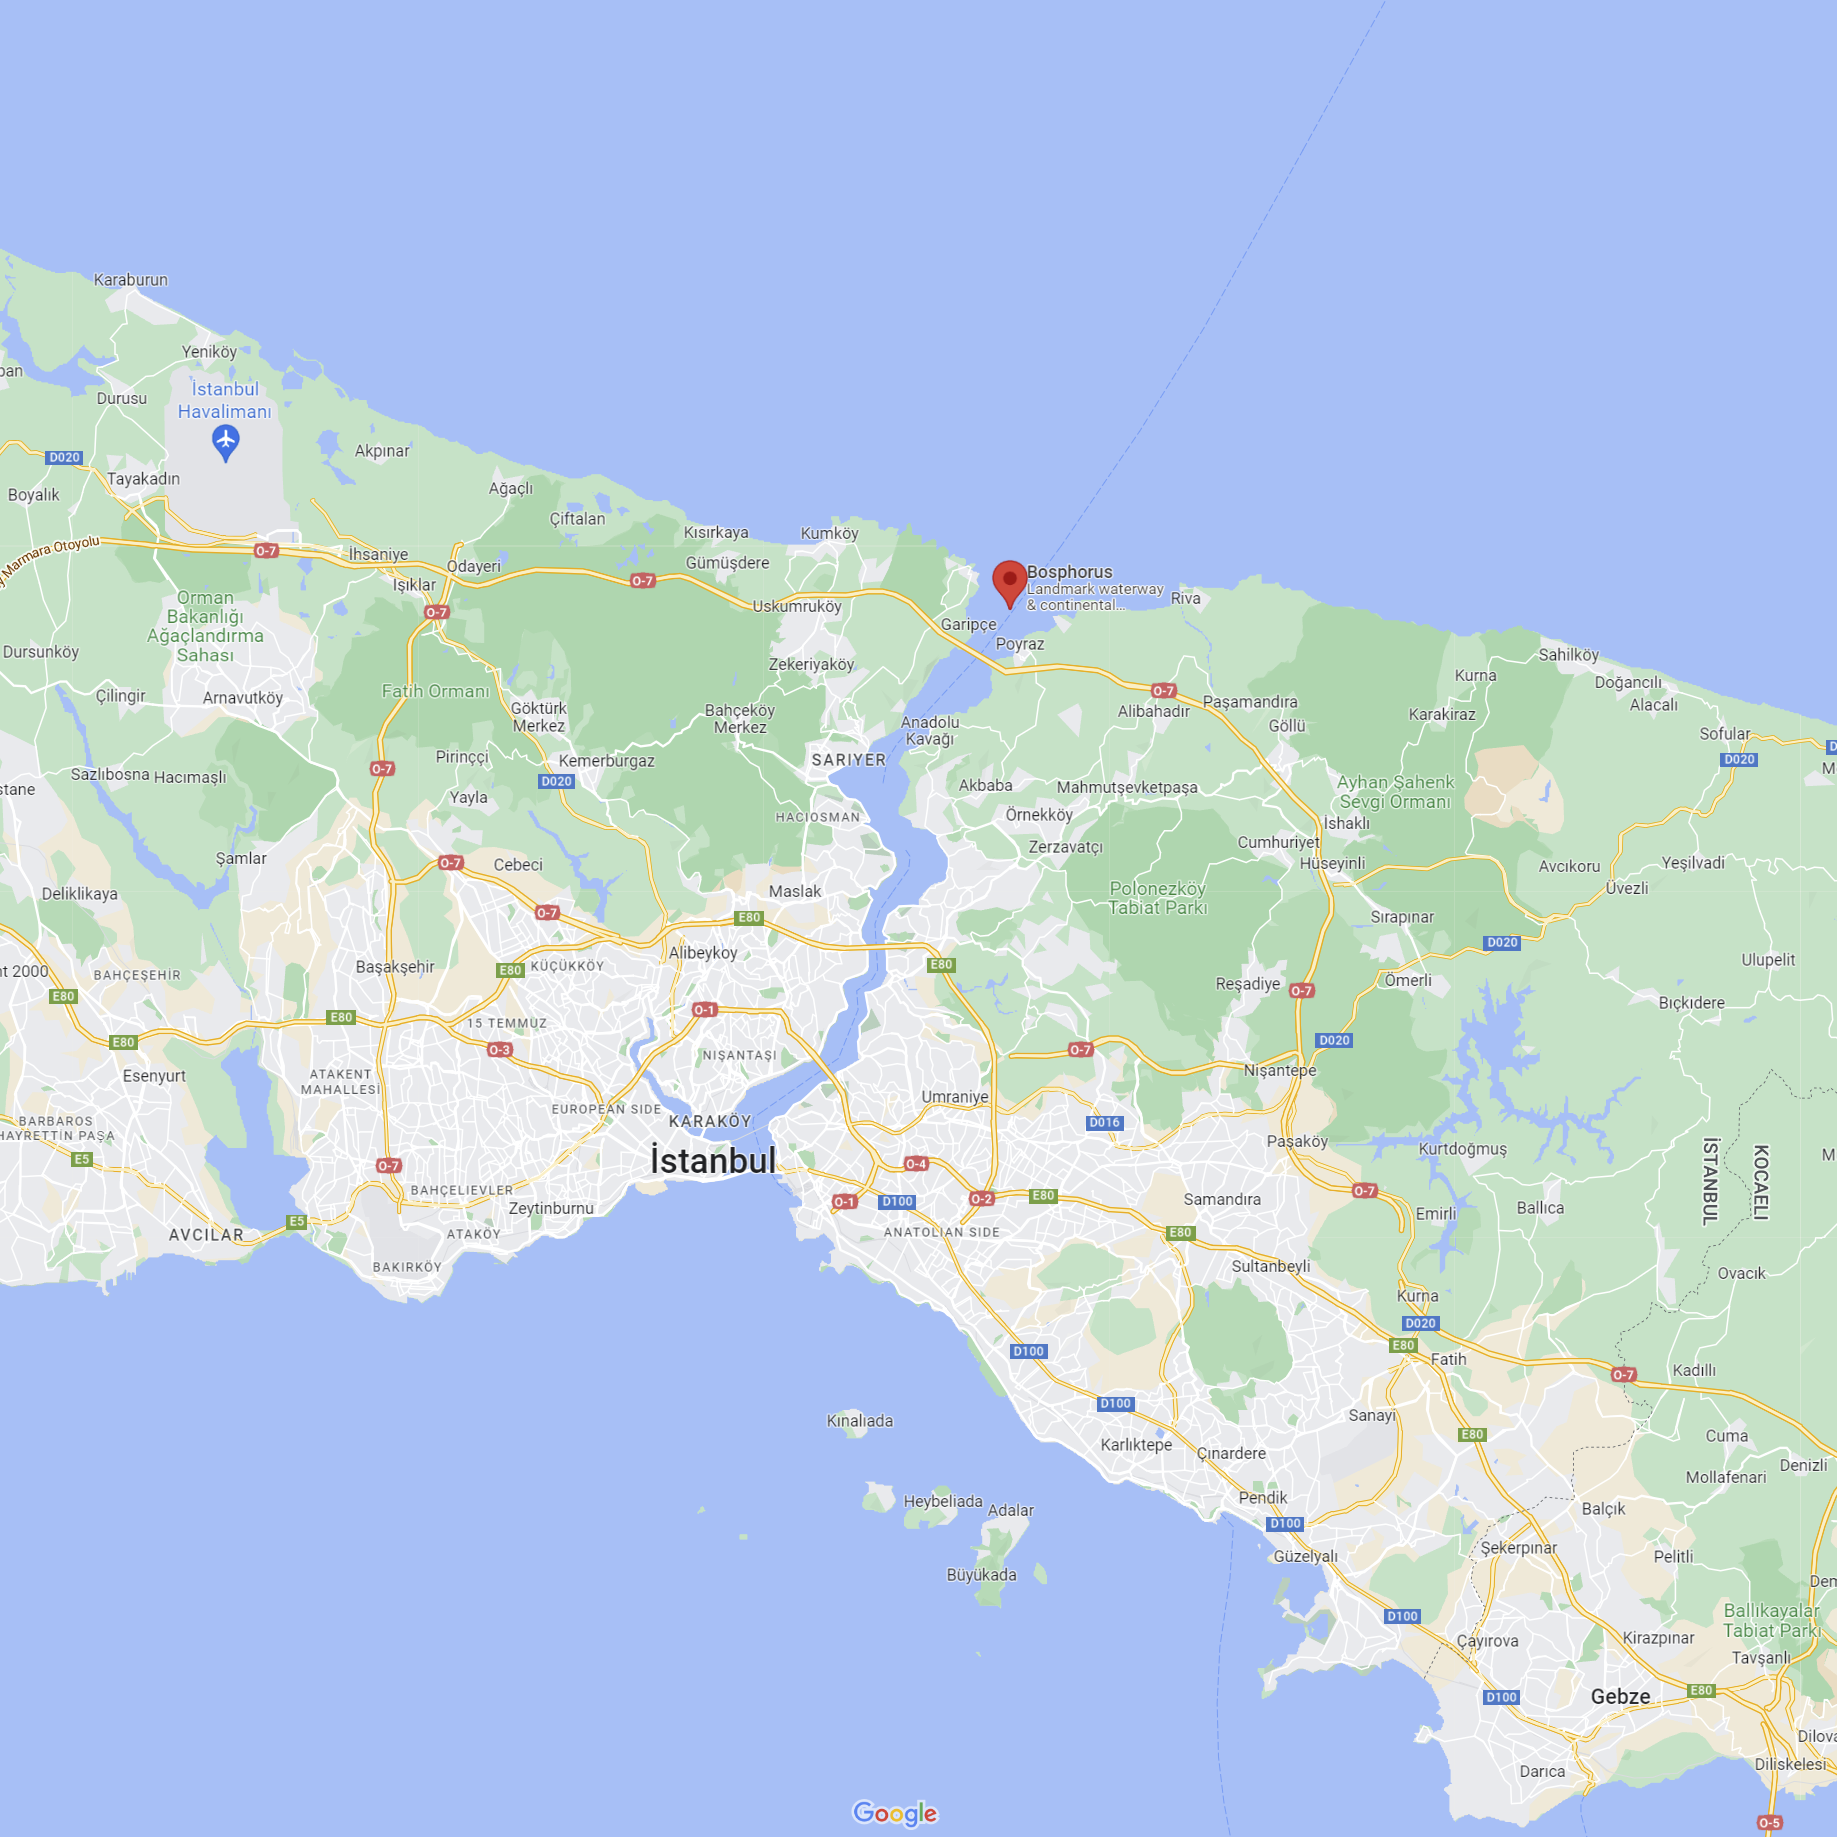
The Bosphorus Straight.
Lunches for conference speakers, organizers and participants were held at the historic and ornate Istanbul University faculty dining room.
A conference welcoming cruise along the Bosphorus proved to be one of the highlights of the conference social activities. The Bosphorus Strait is an internationally significant waterway. It forms part of the continental boundary between Asia and Europe. However, there are now three bridges and a tunnel connecting the European side of Istanbul to the Asian side. A brand-new cruise ship terminal (Galataport) is illustrated below. The Bosphorus allows shipping from the Black Sea to the Sea of Marmara and vice versa. A field trip to dams and aqueducts providing water to European Istanbul was organized on the last day of the conference, October 28th.
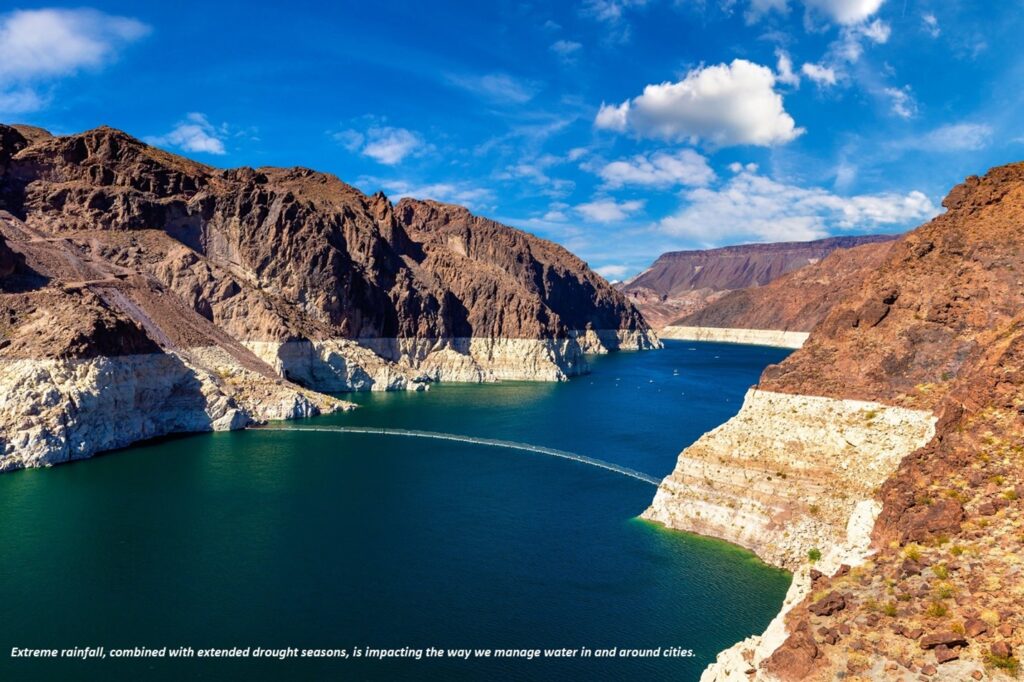
Though dams have existed for centuries, many large dams were built throughout the United States as early as 100 years ago. Initially, dams mainly stored excess water for later use—typically during a drier part of the year. However, dams have grown to become multipurpose infrastructures supporting hydropower generation, drinking water demands, and industrial water supply. Now, we are highly dependent on our dams and the water they store.
Scientists caution that climate change, and the increasing number of extreme weather events, will significantly impact our water resources. In recent years, weather patterns have changed so much, that the rainfall is not as predicable (e.g., Salas et al., 2020; Xu et al., 2022). Many places are getting most of their annual rainfall in a few intense events, while the rest of the year is dry (e.g., Ingram, 2016). Instead of slowly gaining and releasing water throughout the year, in some areas, reservoirs are seeing an influx of a year’s worth of rainfall all at once (e.g., Fleming & Weber, 2012; Maddu et al., 2022; Naz et al., 2018; Yu et al., 2014). This change might not seem significant, but existing dams were simply not designed to accommodate storm water like that.
Imagine a dam is almost full, and a major rainstorm happens. If the dam fills more, it could overflow, and dam safety would be a concern. Likely, you would open the dam gates to release some of the extra water. This prevents water from spilling over the top and prevents the dam from failing entirely. But, if you open the gates, you are losing water. Then, what happens during the dry months?
There are many stakeholders who can contribute to a sustainable watershed. Let us take a closer look at some potential solutions for managing water in a time when precipitation patterns are changing. We can design for excess water, store as much water as possible, and be responsible water stewards.
Designing for Excess Water
This is where urban planners step up—by planning how the city fits into the watershed and how water moves in and around the city. The closer buildings, parking lots, and asphalt roads are to the reservoir inlet, the more quickly large amounts of runoff will enter the reservoir. When impervious surfaces—like concrete and asphalt—are evenly distributed across a watershed, instead of being concentrated in specific locations, it slows down the movement of water (e.g., Ariano & Oswald, 2022; de la Cretaz & Barten, 2007; Roodsari & Chandler, 2017). This concept allows for sustainable development while mitigating the excess flow and delaying the amount of water entering the reservoir (e.g., Liu et al., 2022; R et al., 2020; Wang et al., 2021).
In addition to planning where major developments are built in relation to the reservoir, green spaces within a city are also important. In a dense cityscape, think of green spaces like small sponges. The vegetation can soak up some of the water where it slowly drains into the groundwater system, instead of running off as stormwater and entering a reservoir.
Some urban areas even plan for water collection in and on areas that typically would have just been a source of runoff water. For example, landscape architects can incorporate water-absorbing green roofs where appropriate. Some locations that are prone to flooding might want to consider porous asphalt, where water slowly seeps through roads and parking lots instead of running off or pooling up.
Lastly, from a planning perspective, accounting for how the city will grow can lessen flood consequences. Planners can limit urban expansion to areas outside of potential flooding areas. Landscape architects working together with engineering designers can create resilient watersheds. This will help minimize the impact of climate change to our reservoirs.
Maximizing Water Storage
Sometimes, dam owners can raise the height of the dam to accommodate for more intense rainfall. Though, this solution is not always a viable option. As such, we should think about managing the water before it enters the reservoir. Upstream management measures can be innovative and cost-effective. For instance, several detention ponds can be built to temporarily store the incoming water and gradually release it to reduce the pressure on the main reservoir during an extreme event. Appropriate measures can vary from one watershed to another, but ponds might be a simple and cost-effective solution.
While detention ponds offer a good potential solution, there are also two key drawbacks that make them a less-attractive option. First, dam owners often do not own the upstream lands in the watershed, so trying to build a dam and manage water on someone else’s land might not be possible. Second, from a risk perspective, adding upstream detention ponds increase the risk downstream. If a smaller upstream dam failed, it would release that water all at once, adding greater strain on the main reservoir dam.
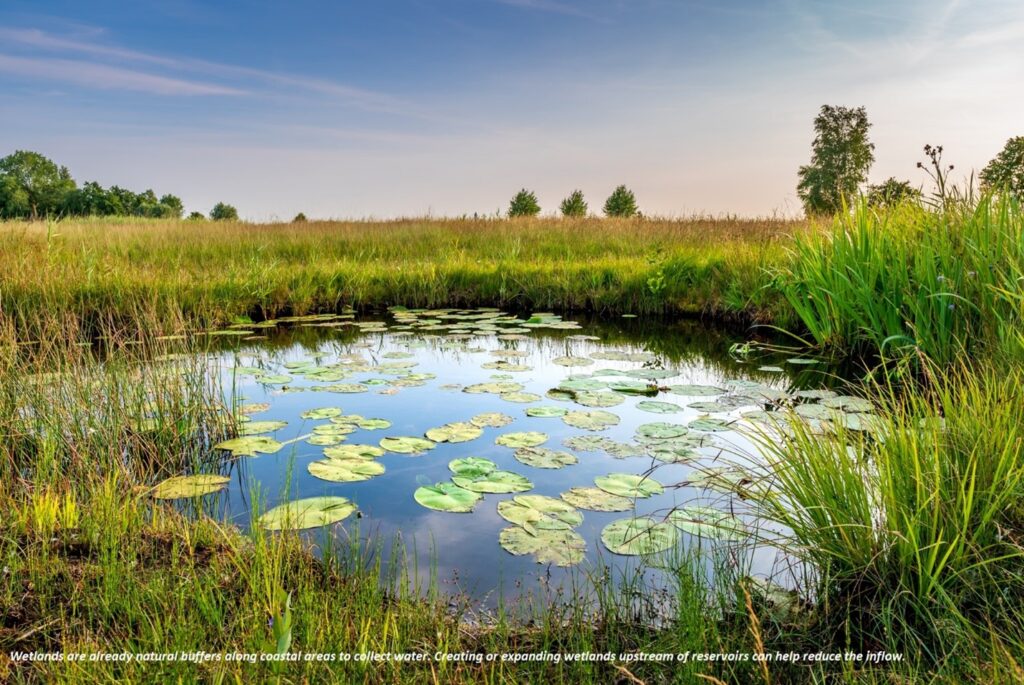
If building a pond or additional reservoir is not feasible, there could be a middle-ground approach of reclaiming or expanding wetlands. A wetland area can provide a natural buffer to soak up excess water upstream of a reservoir. Wetlands also bypass the two major concerns of the temporary detention ponds. Wetlands may be easier to get permission to create or expand, and there is less risk since there are no additional dams to monitor.
Responsible Water Stewardship and Applying Ancestral Lessons
With weather forecasting, we can all be aware of rain patterns, and can even be notified not to water our lawns and outdoor plants before an extreme rainfall event. Some sprinkler systems run from a timer and will go at the same time every day even if it is raining! Rainwater that is absorbed into your yard recharges our groundwater system instead of flowing directly into a reservoir.
Some of the most sustainable and effective measures are not necessarily the most high-tech. Humans have been managing water for centuries, adopting effective means of storing water to survive droughts, even in arid climates. Community members can contribute to effective water management by understanding and applying lessons learned from our ancestral past. Do not discount your role in managing our limited water resources; we all play a part!
References
Ariano, S. S., & Oswald, C. J. (2022). Broad scale assessment of key drivers of streamflow generation in urban and urbanizing rivers. Hydrological Processes, 36(4), e14579. https://doi.org/https://doi.org/10.1002/hyp.14579
de la Cretaz, A. L., & Barten, P. K. (2007). Land Use Effects on Streamflow and Water Quality in the Northeastern United States (0 ed.). CRC Press. https://doi.org/10.1201/9781420008722
Fleming, S. W., & Weber, F. A. (2012). Detection of long-term change in hydroelectric reservoir inflows: Bridging theory and practise. Journal of Hydrology, 470–471, 36–54. https://doi.org/10.1016/j.jhydrol.2012.08.008
Ingram, W. (2016). Extreme precipitation: Increases all round. Nature Clim. Change, 6(5), 443–444. http://dx.doi.org/10.1038/nclimate2966
Liu, W., Qian, Y., Yao, L., Feng, Q., Engel, B. A., Chen, W., & Yu, T. (2022). Identifying city-scale potential and priority areas for retrofitting green roofs and assessing their runoff reduction effectiveness in urban functional zones. Journal of Cleaner Production, 332, 130064. https://doi.org/https://doi.org/10.1016/j.jclepro.2021.130064
Maddu, R., Pradhan, I., Ahmadisharaf, E., Singh, S. K., & Shaik, R. (2022). Short-range reservoir inflow forecasting using hydrological and large-scale atmospheric circulation information. Journal of Hydrology, 612, 128153. https://doi.org/10.1016/j.jhydrol.2022.128153
Naz, B. S., Kao, S.-C., Ashfaq, M., Gao, H., Rastogi, D., & Gangrade, S. (2018). Effects of climate change on streamflow extremes and implications for reservoir inflow in the United States. Journal of Hydrology, 556, 359–370. https://doi.org/10.1016/j.jhydrol.2017.11.027
R, M. K., L, H. S., Jia, L., Trevor, H., & Shawn, H. J. M. (2020). Spatial Configurations of Land Cover Influence Flood Regulation Ecosystem Services. Journal of Water Resources Planning and Management, 146(11), 04020082. https://doi.org/10.1061/(ASCE)WR.1943-5452.0001294
Roodsari, B. K., & Chandler, D. G. (2017). Distribution of surface imperviousness in small urban catchments predicts runoff peak flows and stream flashiness. Hydrological Processes, 31(17), 2990–3002. https://doi.org/10.1002/hyp.11230
Salas, J. D., Anderson, M. L., Papalexiou, S. M., & Frances, F. (2020). PMP and Climate Variability and Change: A Review. Journal of Hydrologic Engineering, 25(12), 3120002. https://doi.org/10.1061/(ASCE)HE.1943-5584.0002003
Wang, Y., Zhang, X., Xu, J., Liang, C., She, D., & Xiao, Y. (2021). Evaluating effects of urban imperviousness connectivity on runoff with consideration of receiving pervious area properties. Urban Water Journal, 18(8), 598–607. https://doi.org/10.1080/1573062X.2021.1918182
Xu, Z., Chang, A., & di Vittorio, A. (2022). Evaluating and projecting of climate extremes using a variable-resolution global climate model (VR-CESM). Weather and Climate Extremes, 38, 100496. https://doi.org/https://doi.org/10.1016/j.wace.2022.100496
Yu, P.-S., Yang, T.-C., Kuo, C.-M., Chou, J.-C., & Tseng, H.-W. (2014). Climate change impacts on reservoir inflows and subsequent hydroelectric power generation for cascaded hydropower plants. Hydrological Sciences Journal, 59(6), 1196–1212. https://doi.org/10.1080/02626667.2014.912035


 Dr. Koehler is the CEO of Visual Data Analytics and a certified professional hydrologist with over 40-years’ experience.
 About the author
 I am honored to serve the American Institute of Hydrology (AIH) in my new role as President-Elect. What a rewarding journey it has been! I have learned so much in these last three years while serving as Treasurer (2020), Director of Institute Development (2021-2022), and now as President-Elect.
 I am truly energized about my new leadership role these next few years with AIH. As President, I want to make connections, provide synergy, and fully utilize the strong leadership qualities of our Board members and members at large. I am excited about our committees and initiatives – not only for the resulting benefits, but for the process of getting to know each one of you through your involvement. It is critical that all AIH members get involved, whether it’s helping establish the DEI scholarship, expanding our webinar series, or improving our website for AIH members and the public.


 s! This is my last President’s Message, and it comes soon after our Board of Directors convened for our AIH Annual Meeting. During the meeting, our Board of Directors reflected on accomplishments and challenges from the past year and established specific strategies and tactics to achieve goals for 2023. I’m delighted about the continued achievements of AIH during my tenure as President, and I’m excited about the next steps for the organization.