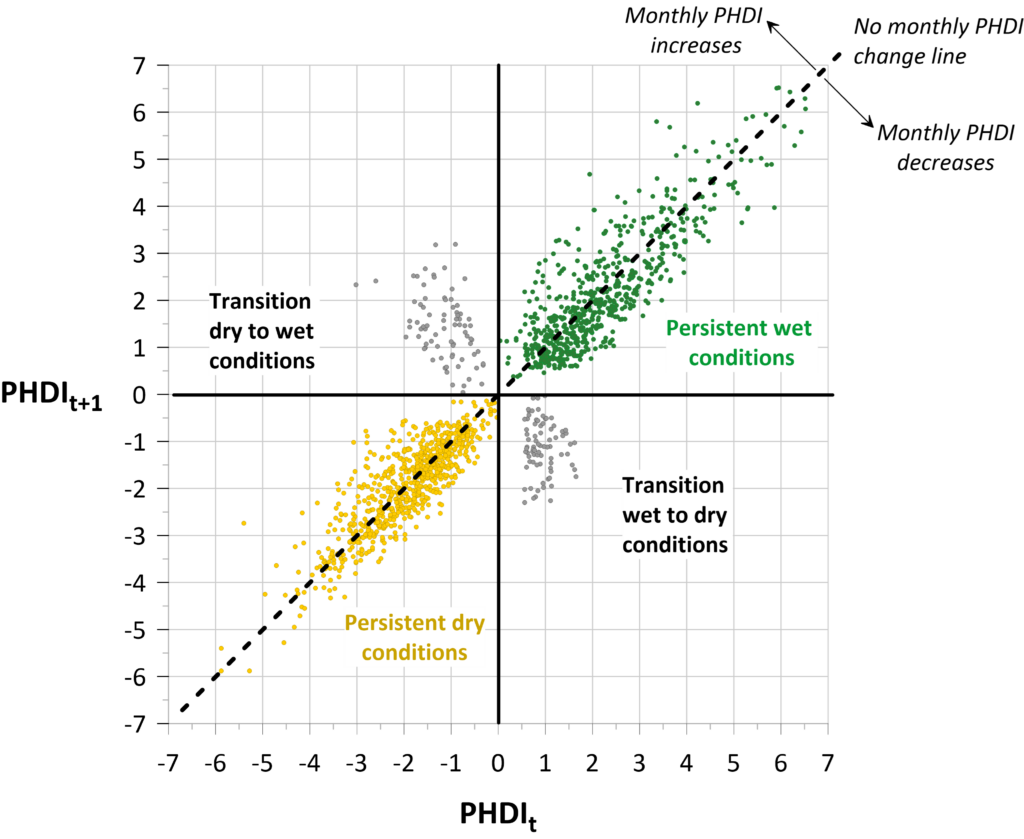
The AIH Diversity, Equity, and Inclusivity (DEI) Committee has landed on an exciting priority initiative: the DEI Scholarship Fund. Since beginning its work early in 2022, the DEI Committee has developed several initiatives to further its goal of extending educational and professional opportunities to those not commonly represented in hydrology-related fields. These initiatives include:
- An International Mentorship Program
- Minority Serving Institutions Outreach
- An AIH Speakers Bureau
- A Hydrology Job and Career Portal
Approved by the AIH Board of Directors at the May 23
rd Meeting, the DEI Scholarship Fund will make funding available to selected individuals for hydrology-related training or education. As part of its action, the Board approved seed money for the Fund from revenue collected by the AIH Career Center, an on-line AIH service for advertising job opportunities. It is anticipated that additional revenue for the Fund will come from voluntary AIH membership contributions and corporate sponsors.
There is much to be done!
The DEI committee invites your participation in committee activities including development of the Scholarship Fund and the other DEI initiatives. With the Scholarship Fund being approved by the AIH Board of Directors, it’s time for the DEI Committee to get busy developing the details of implementation including program criteria and management, recipient selection, funding sources, and program outreach. The goal of the DEI Committee is to start awarding funds in 2026.
To join the AIH DEI Committee, or for additional information on the Scholarship Fund and other DEI Committee initiatives, contact Committee Co-Chairs Matt Naftaly at
mnaftaly@Dudek.com or 805.308.8529 or John Ramirez at
jramirez@cee.msstate.edu or 662.325.9885.
To make a donation to the fund, use the button below. Donations are not tax-deductible.
The AIH Diversity, Equity, and Inclusivity (DEI) Committee has landed on an exciting priority initiative: the DEI Scholarship Fund. Since beginning its work early in 2022, the DEI Committee has developed several initiatives to further its goal of extending educational and professional opportunities to those not commonly represented in hydrology-related fields. These initiatives include:
- An International Mentorship Program
- Minority Serving Institutions Outreach
- An AIH Speakers Bureau
- A Hydrology Job and Career Portal
Approved by the AIH Board of Directors at the May 23rd Meeting, the DEI Scholarship Fund will make funding available to selected individuals for hydrology-related training or education. As part of its action, the Board approved seed money for the Fund from revenue collected by the AIH Career Center, an on-line AIH service for advertising job opportunities. It is anticipated that additional revenue for the Fund will come from voluntary AIH membership contributions and corporate sponsors.
There is much to be done!
The DEI committee invites your participation in committee activities including development of the Scholarship Fund and the other DEI initiatives. With the Scholarship Fund being approved by the AIH Board of Directors, it’s time for the DEI Committee to get busy developing the details of implementation including program criteria and management, recipient selection, funding sources, and program outreach. The goal of the DEI Committee is to start awarding funds in 2026.
To join the AIH DEI Committee, or for additional information on the Scholarship Fund and other DEI Committee initiatives, contact Committee Co-Chairs Matt Naftaly at mnaftaly@Dudek.com or 805.308.8529 or John Ramirez at jramirez@cee.msstate.edu or 662.325.9885.
To make a donation to the fund, use the button below. Donations are not tax-deductible.


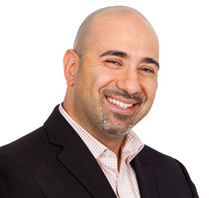
 Dr. Koehler is the CEO of Visual Data Analytics and a certified professional hydrologist with over 40-years’ experience.
 About the author
 Founder’s Award:

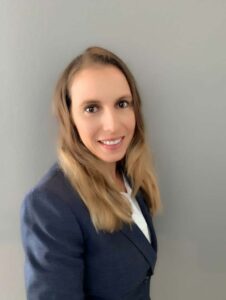
 I am honored to serve the American Institute of Hydrology (AIH) in my new role as President-Elect. What a rewarding journey it has been! I have learned so much in these last three years while serving as Treasurer (2020), Director of Institute Development (2021-2022), and now as President-Elect.

 I am truly energized about my new leadership role these next few years with AIH. As President, I want to make connections, provide synergy, and fully utilize the strong leadership qualities of our Board members and members at large. I am excited about our committees and initiatives – not only for the resulting benefits, but for the process of getting to know each one of you through your involvement. It is critical that all AIH members get involved, whether it’s helping establish the DEI scholarship, expanding our webinar series, or improving our website for AIH members and the public.

 s! This is my last President’s Message, and it comes soon after our Board of Directors convened for our AIH Annual Meeting. During the meeting, our Board of Directors reflected on accomplishments and challenges from the past year and established specific strategies and tactics to achieve goals for 2023. I’m delighted about the continued achievements of AIH during my tenure as President, and I’m excited about the next steps for the organization.