
Introduction
The Hydrologic Modeling System (HMS) is software developed by the Hydrologic Engineering Center designed to simulate precipitation-runoff processes of dendritic watershed systems. HEC-HMS provides a wide range of scalable methods for modeling hydrologic processes, delivers a modern and efficient user interface, supports robust optimization and uncertainty analysis capabilities, and has available complete documentation and training options for the engineering community. It is designed to be applicable for a wide range of geographic areas to solve the widest possible range of problems. This includes large river basin water supply and flood hydrology, and small urban or natural watershed runoff.
The HEC-HMS team has recently modernized its software development process following Continuous Integration & Continuous Delivery principals. The results have been faster releases of new features, quicker turnaround for bug fixes, lower bug count in the official release, and easier collaboration with other developers. The current development version of HEC-HMS is version 4.10, which is planned to be released by summer of 2022. HEC-HMS version 4.10 includes numerous updates to the software, including a new compute option, new and refined meteorological methods, enhanced methods to display spatial results, and many more improvements. Other improvements and features that will be released with 4.10 include:
- Dynamic Reservoir Volume Reduction Method
- Simplex Optimization Improvements
- Resume Differential Evolution Optimization
- Normalized Nash-Sutcliffe Efficiency Optimization Objective Function
- Peak-Weighted Variable Power Optimization Objective Function
- Snowmelt Plots
- 2D Diffusion Wave Transform and 2D Sediment Transport Enhancements
We encourage users to visit the HEC-HMS webpage to learn more about current software updates: https://www.hec.usace.army.mil/confluence/hmsdocs/hmsum/latest/release-notes/v-4-10-0-release-notes
Frequency Analysis Compute
The new Frequency Analysis compute option in HEC-HMS is similar in nature to the existing Depth-Area Analysis framework that analyzes multiple points within a watershed at a single frequency. The Frequency Analysis compute option allows the user to analyze a single point over a range of different frequencies. A Frequency Analysis can have one to many ordinates defined, each with their own assigned annual exceedance probability, meteorological model, and basin model. Currently, the analysis can be used to generate a flow frequency curve or a stage frequency curve at the point of interest. Figure 1 shows the computed peak flow frequency curve output window from HEC_HMS at a specified location.
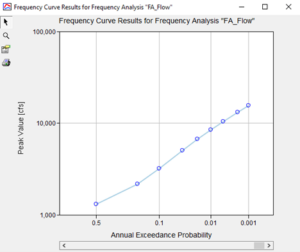
Figure 1: Peak flow frequency curve generated from Frequency Analysis compute option
Interpolated Meteorology
An interpolation option was added to the precipitation, temperature, windspeed, solar radiation, and evapotranspiration methods in the meteorological model. The interpolation option interpolates between gaged locations and creates a series of time-series grids over a gridded domain, or time-series at point locations if interpolating over a non-gridded domain. The interpolation can be performed over a range of time increments (daily, sub-daily, etc.) and simulation time-steps. The interpolation methods include inverse-distance squared, inverse-distance, nearest-neighbor, and bilinear. There is an option to bias correct a precipitation interpolation and lapse adjust a temperature interpolation. The interpolated results are cached to disk in an HEC-DSS file. The cached results are accessed on subsequent computes, unless a parameterization change occurs and invalidates the cache, triggering a re-compute. The time-series gages that are selected for interpolation must be parameterized with a valid longitude and latitude. Figure 2 shows the HEC-HMS Map Window demonstrating the interpolated precipitation capabilities for the Truckee River watershed.

Figure 2: Interpolated precipitation grid computed from point rainfall gages and PRISM bias grid using the Interpolated Precipitation meteorological method
Frequency Storm Meteorological Model Enhancements
New features for the Frequency Storm and Hypothetical Storm precipitation methods streamline their use for flow-frequency simulations. Multiple precipitation frequency grids downloaded from NOAA Atlas 14 can now be imported using the Precipitation Frequency Grid Importer. This feature also internalizes external source files for the grids by copying them to the project directory. The Frequency Precipitation Calculator tool can be used to quickly calculate average precipitation depths. These computed precipitation depths can be applied at either the watershed or subbasin level. Figure 3 shows the Frequency Precipitation Calculator. The Frequency Depths Calculator is only available if the meteorological model has been linked to a subbasin model that contains georeferenced subbasin elements.
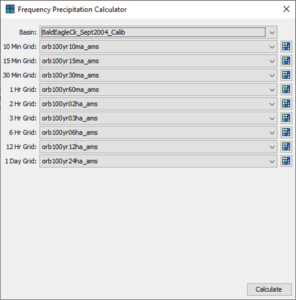
Figure 3: Frequency Precipitation Calculator using NOAA Atlas 14 Precipitation-Frequency grids
The frequency storm meteorological model also allows for a User-Specified area reduction method to be applied, shown in Figure 4. This new option allows the user to specify a depth area-reduction function and apply it to each of the inner durations of a frequency storm.
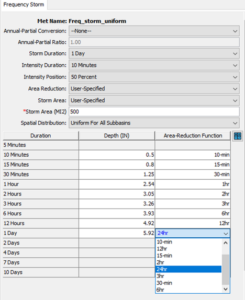
Figure 4: User Specified Areal reduction factor for each precipitation duration
Viewing and Exporting Spatial Results
The HEC-HMS team is constantly developing new and improved options for visualizing model results. Evaluating model performance is critical for model refinement and conveying results. A legend, scale bar, and north arrow can now be displayed within the desktop when a valid spatial result or calibration metric is selected. These options can be enabled through the View menu. An example of these new visualization items is shown in Figure 5. Additionally, Min and Max buttons were added to the Spatial Results toolbar that allow for quick visualization of the minimum or maximum values of any spatial result regardless of the time in which they were computed.
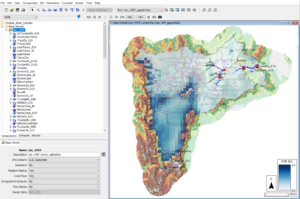
Figure 5: Legend, scale bar, and north arrow displayed for the Truckee River watershed Map window. Min and Max buttons also shown on Spatial Results toolbar
An Export Snapshot button and an Export Recording button were added to the Spatial Results toolbar. The Export Snapshot button, when pressed, will allow the user to export the currently selected spatial result at the current display time step as a GeoTIFF file. The resultant file will be georeferenced and can be read by common GIS software (e.g., QGIS, ArcGIS). The Export Recording button, when pressed, will allow the user to export an animation of the currently selected spatial result to either AVI or MP4 file. The resultant animation will also include any currently displayed maps, such as subbasin outlines, reservoir icons, and terrain.
The Spatial Results toolbar can show calibration results for flow and snow water equivalent (SWE). This feature adds visuals for assessing the calibrated state of a basin model. Computed statistical metrics, such as Nash Sutcliffe Efficiency (NSE), Coefficient of Determination (R2), Root Mean Square Error / Standard Deviation (RSR), and Percent Bias (PBIAS), are used to color-code each subbasin, as shown in Figure 6.
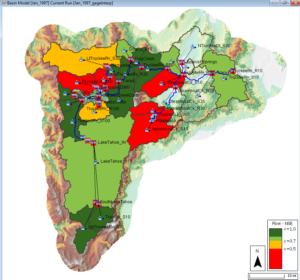
Figure 6: Spatial Results calibration results map layer for flow
About Authors
The HEC-HMS Team consists of Matthew Fleming, Thomas Brauer, Michael Bartles, Gregory Karlovits, Jay Pak, Nick Van, Josh Willis, Daniel Black, Natasha Sokolovskaya, Alex Sanchez, Alex Davis, and David Ho. Team members all work for the U.S. Army Corps of Engineers and come from a wide variety of backgrounds – Civil Engineers, Hydrologists, Geologists, and Computer Scientists. All team members are competent in multiple disciplines of HMS teamwork, such as developing the software, testing the software, documenting, training, providing technical support, and supporting with hydrologic studies.
Any questions about this article can be directed to David Ho at David.ho@usace.army.mil
References
Gene Kim, Patrick Debois, John Willis, and Jez Humble. 2016. The DevOps Handbook: How to Create World-Class Agility, Reliability, and Security in Technology Organizations. IT Revolution Press.