President’s Message

AIHPresident Jamil Ibrahim

Greetings! The end of the calendar year is a common period for self-reflection by individuals and organizations. As I look back while concluding the first year of my two-year term as your American Institute of Hydrology (AIH) President, I’m delighted about the accomplishments of your AIH leadership team during 2021. Our achievements this year, however, are not just a function of what we did during 2021 – they consider the steps taken by AIH over the past few years to address challenges and introduce new perspectives, along with the great work of your leadership team.

We did great things in 2021! Thank you to all who contributed. Here’s a snapshot of our accomplishments:

  • Boosted AIH’s membership by 22% compared to 2020 and received 35% more new member applications during 2021 compared to the previous year.
  • Held the Institute’s first virtual meet-and-greet event with AIH members.
  • Connected our AIH community through in-person Water New Year celebrations in Minneapolis, Minnesota and Sacramento, California. One of the three co-founders of AIH, Roman Kanivetsky, joined in the Minneapolis event!
  • Welcomed our first Hydrologic Technician (HT) to serve as a member of AIH’s leadership team on our Executive Committee (EC).
  • Completed a widely popular and informative webinar series on the topic of Forecast Informed Reservoir Operations (FIRO). Our FIRO series, provided in collaboration with the American Water Resources Association (AWRA), featured our nation’s top experts on FIRO, an innovative strategy for water resources management that leverages use of advanced hydrological and meteorological data.
  • Convened a new Diversity, Equity, and Inclusion (DEI) Task Force composed of AIH members and members from the EC. Stay tuned – you will have an opportunity to learn more and support the important activities our DEI Task Force will be initiating within the next few months.
  • Revamped our membership application and database system. Despite the glitches our administration team encountered after the rollout, we’re confident our modernization changes will improve ease of application development by prospective members, application review and processing by our Board of Registration, and provide enhanced member benefits through access of information and content.
  • Presented to audiences at professional conferences about AIH and the importance of Professional Hydrologist (PH) certification for hydrologists and HT certification for hydrologic technicians, including: Groundwater Resources Association of California’s (GRAC) Future of Water Conference; Consortium of Universities for the Advancement of Hydrologic Science’s (CUAHSI) Biennial Colloquium; AWRA’s 2021 Annual conference; and the University of Minnesota’s 2021 Minnesota Water Resources Conference.
  • Improved social media presence and member connectivity.
  • Coordinated with researchers for the U.S. Department of Labor on development of information on hydrologist and hydrologic technician occupations.

Also, we are nearly complete with revisions and updates to AIH’s Bylaws and a contracting solicitation for AIH examination support services–both scheduled for distribution early in 2022.

Again – Thank you to all who have stepped forward to take on roles to help advance the mission of AIH. Member participation is vital to AIH’s success and we are eager to engage more members in AIH activities. Even if not interested in taking on a leadership role for AIH or getting involved in various subcommittees or groups, we request all our members to be ambassadors for AIH and its certified members. Please contact me or others on our leadership team to learn more about how to get involved.

Sincerely,

Jamil S. Ibrahim PH, PMP, ENV SP

AIH President, 2021-2022

Former AIH President Delivers a Keynote Address at the Latin American Congress of Civil Engineering Students

Former AIH President Delivers a Keynote Address at the Latin American Congress of Civil Engineering Students

From November 14-20, 2021, over 120 civil engineering students from nine Latin American countries attended the COLEIC (Latin American Congress of Civil Engineering Students) 2021 event in Tarija, Bolivia.

Dr. Miguel A. Medina, Jr., PH (AIH President, 2009-2010) delivered a keynote presentation on November 17th titled “Water Resources of Bolivia, Integration of Hydrologic Cycle Processes, Climate Change Challenges, Adaptation and Professional Opportunities.” That same day he was invited to the Municipality of Tarija and presented with an ordinance declaring him a Distinguished Visitor. While at the Tarija City Hall, he was interviewed by a local journalist regarding his findings of potential climate change in Tarija.

Medina

The following morning a national Bolivian TV (UNITEL) news crew interviewed him live at the Hotel Vendimia lobby on the topic of Bolivian water resources and management, as well as potential climate change implications. The broadcast was also presented again that evening on a national news segment.

On November 18th, Medina also participated in a forum discussion on climate change implications for the civil engineering and hydrology professions.

For his presentation, Medina examined the annual maxima series of precipitation at three recording stations in the region: Tarija (1944-2020), Juntas (11976-2020) and Cañas (1977-2020).

Nonstationary time series analysis with the Generalized Extreme Value Distribution (GEV) was applied to the three stations.

Both Tarija and Juntas exhibited a slight decrease in precipitation. However, at a higher elevation over a mountain ridge, Cañas exhibited a substantial increase in precipitation.

Both deterministic and statistical methods were discussed, as well as surface-subsurface interactions across the hydrologic cycle. The presentation ended with recommendations for infrastructure adaptation to climate change, increased monitoring needs, and a review of current standards. Specific recommendations followed for future training of civil engineers and hydrologists to enhance their professional opportunities.

Institute Development Recap

Institute Development Recap

This past fall, the American Institute of Hydrology participated in two hydrology related conferences: 2021 Minnesota Water Resources Conference (MWRC) on October 19, 2021 and the American Water Resources Association (AWRA) on November 10, 2021.

Minnesota Water Resources Conference

At the MWRC conference, Salam Murtada (VP of Institute Development), Brennon Schaefer (VP of Communication) and John Nieber (past president of AIH) co-authored a presentation titled “American Institute of Hydrology: Certifying the Practice of Hydrology”. The presentation provided an overview of AIH, history, current membership composition, certification process and on-going activities. It was attended by over 100 people. The conference, which was held virtually this year, was attended by over 800 water resources professionals representing students, university teachers, consultants and government officials at the federal, state and local levels. The MWRC is held annually around the middle of October in St. Paul, Minnesota.

At the AWRA conference, AIH participated at the gold level sponsorship. During the reception, Salam Murtada gave a brief presentation about AIH followed by award announcements for three outstanding hydrologists: Vicki Kretsinger Grabert who was awarded the Charles V. Theis Award for contributions to groundwater, Dr. Phil Bedient who was awarded the Ray K. Linsley award for contributions to surface water and Dr. Ying Ouyang who was awarded the Robert G. Wetzel award for contributions to water quality. The AWRA conference was also held virtually this year due to the pandemic.

Vicki Kretsinger Grabert, PH     Dr. Phil BedientDr. Ying Ouyang, PH
Charles V. Theis Award for Contributions to GroundwaterRay K. Linsley Award for Contributions to Surface WaterRobert G. Wetzel Award for Contributions to Water Quality

We hope to continue collaborating with MWRC, AWRA and other organizations such as the Consortium of Universities for the Advancement of Hydrologic Science, Inc (CUAHSI), Groundwater Resources Association (GRA) and the American Geoscience Institute (AGI) among many others.

Membership Renewals

Membership Renewals

Please be reminded that your membership with AIH will expire on January 15, 2022. We encourage you to renew your dues now. Renewal of dues should be completed through the Certemy platform.

We hope you will take the time to renew your membership and remain part of our community. AIH’s dedication to the organization and commitment to the hydrology industry is unprecedented. You want to continue to be a part!

We value all contributions to AIH, as we recognize that without committed and involved members, AIH would not be where it is today. Your involvement is important and very much appreciated.

AIH offers numerous reasons to continue to stay involved:

  • Continuous membership is required to maintain current status as a certified member.
  • AIH offers access to its online membership directory in a member portal environment.
  • Receive peer, employer, industry, and client recognition of technical expertise in hydrology.
  • Hydrologist certification satisfies requirements for jobs in many states.
  • Access to National Registry of Certified Professional Hydrologists network.
  • Discount on AIH publications and events.

We would like to thank the entire American Institute of Hydrology (AIH) organization for its involvement and support this past year. We accomplished a lot!

If your certification type has changed since you last renewed, or you find yourself having issues accessing your Certemy profile, please contact the AIH office at admin@aihydrology.org or call (916) 231-2149.

Spotlight on Recent AIH Exams and on New Members

Spotlight on Recent AIH Exams and on New Members

Congratulations to those who recently passed their exams during November 2021 and all new members welcomed during the second half of 2021!

Hydrologist-in-Training

  • Dillon Vogt, HIT

Professional Hydrologist

  • Megan Arpino, PH (surface water)
  • William Chatron, PH (surface water)
  • Justin Coffman, PH (surface water)
  • Rheannon Hart, PH (surface water)
  • Matt Sparacino, PH (surface water)
  • Max Strickler, PH (surface water)
  • Kaveh Zamani, PH (surface water)

Book Review by Donald Anderson, PH, Cresta Hydrologics, LLC

By David Owen, Riverhead Books, 2017

The Colorado River is often referred to as “America’s hardest-working river.” As it winds through some of the driest land in the country, it supplies water for more than 40 million people and 5.7 million acres of irrigated lands in seven western states, plus a small slice of Mexico. It eventually dribbles into the dry soils of Baja California, Mexico before reaching its natural historic outlet – the Gulf of California.

The aforementioned population and irrigated acreage values should be considered rather provisional, given the ongoing drought that is diminishing the basin’s water supplies. The Bureau of Reclamation cites a 34% probability that water levels in the massive Lake Powell Reservoir, which stores runoff from the 108,000-square-mile “upper basin” and regulates that water for “lower basin” use, will drop too low to generate hydropower in 2023. This has never happened before Thus, Reclamation implemented emergency measures this year to move 181,000 acre-feet of water down to Lake Powell from its higher-elevation reservoirs in an unprecedented scramble to prop up reservoir storage.

How did America’s hardest-working river come to this sorry state? Where the Water Goes, by David Owen, takes the reader on a journey to understand the convoluted story of how and why the Colorado River can no longer provide what we’ve asked of it in the past.  Consider that  when Owen’s book was published just four years ago, Lake Powell still held 7.4 million more acre-feet of water than today!

Owen’s account is aimed at a broad audience. His writing is light on numbers but heavy on stories illuminating the people, places, and activities associated with the river and its myriad users. He winds his way down the river system in a rental car, from the Colorado headwaters through Utah, Arizona, Nevada and California. We meet families irrigating vineyards in Colorado’s Grand Valley. We meet water managers in Denver and Las Vegas. We meet environmentalists seeking to re-hydrate desiccated wetlands in Mexico’s Colorado River Delta. We tag along with farmers in California’s Imperial Valley growing lettuce for America’s dinner tables, and forage for a global cattle market.

Through these stories, Owen (a staff writer for New Yorker) effectively describes the various hopes, expectations, regulations and stresses that have shaped management of Colorado River flows since the first 14-mile canal was hand-dug in 1890 to move water out of the basin’s headwaters to thirsty agricultural lands on the far side of the Rocky Mountains. His journey is a travelogue as much as a treatise on the Colorado River. This may annoy readers who might prefer more hydrology and fewer human-interest digressions. Nevertheless, through intriguing discourse, Owen skillfully portrays  the convoluted history of the Colorado River – a waterway that has produced, over time, the maddeningly complex body of laws and regulations governing its management.

Importantly, Owen also illustrates how this byzantine body of regulations frequently stands in the way of implementing effective long-term solutions to the problem of over-allocation. As Owen puts it, “If you picked just about any high school civics class in the country and gave its students a year to gather information and think, they could almost certainly come up with an approach to western water use that would be more rational than the arcane patchwork we have currently.”

But, as Owen notes, that’s not going to happen. Instead, those responsible for managing the Colorado will need to collectively determine a path forward through this tangled administrative puzzle by applying creativity, collaboration, and — inevitably — large sums of cash needed to overhaul the status quo.

Owen helpfully reviews various possible paths forward in his final chapter “What is to be Done?” Various proposals — ranging from cloud-seeding to reducing water allocations to importing water from the Great Lakes — are individually examined, highlighting each of their weaknesses. The clear take-home message is that there are no simple solutions. But, also, there is little time to waste. The river is grossly over-allocated, climate change will almost certainly aggravate supply shortages, and managers simply don’t have all the tools they need today to resolve the challenges they’ve inherited.

With Lake Powell now depleted to its lowest level since first filling in the late Sixties, and with the first mandatory water-use cutbacks already impacting water users in Arizona (thereare more to come), we’ve essentially run out of time. Where the Water Goes will help readers retrace the steps that brought us to this eleventh-hour dilemma.

About the Reviewer

Prior to his recent retirement from federal service, Donald Anderson served as the Instream Flow Coordinator for the Upper Colorado River Endangered Fish Recovery Program, a public-private partnership that recovers endangered native fish populations while water development continues in the upper Colorado River basin. Mr. Anderson now provides his part-time consulting services through Cresta Hydrologics, LLC, based in Denver, Colorado.

Comparing the Results of HEC-RAS and DHM for Two Dimensional Diffusion Wave

By Theodore .V. Hromadka II (1) and Prasada Rao (2)

(1) Professor, Department of Engineering-Mathematics, United States Military Academy, West Point, NY.

(2) Professor, Department of Civil and Environmental Engineering, California State University, Fullerton, CA.

Abstract

For simulating flows where inertial forces dominate over frictional forces, as in many types of floods, the solution of the two dimensional diffusion wave equation will suffice (compared to a one dimensional simulation). The associated numerical models are reliable and computationally efficient, thus not warranting the amount of resources that are required for solving the full momentum equations. In this work, the reliability of the USGS Diffusion Hydrodynamic Model (DHM) is cross checked by comparing its results with the more widely used HEC-RAS model. The close agreement between the two sets of computational results underscores the reliability of the legacy DHM.

Key words: Two dimensional models, Diffusive wave, HEC-RAS, DHM

Introduction

Numerical models developed in the 1980’s and earlier, during which period, computer memory and speed were significant modeling constraints, are increasingly called “legacy” models. The mathematical underpinnings in these models coupled with their reliability has made their solution to serve as a benchmark solution for the modern software. That is, providing another computational opinion to the problem under study using the prior technology. While some legacy models have been altered to accommodate more complex fluid dynamics (by adding modules to simulate flow turbulence, simplifying the data input requirements, and/or enhancing the model output/visualization modules), other legacy models have focused on access to their core algorithms, laying a foundation to newer models. DHM [1] is an example of such a legacy, first generation, hydraulics model developed for the USGS in the mid 1980’s time period, which led to publication of a USGS Technical Report in 1987. The model was written in Fortran 77, and has been extensively applied to different overland, coupled channel, and overbank flow scenarios. The DHM also served as a foundation for other finite-difference algorithms [2] resulting in additional computational programs for solving a variety of transport problems.

DHM solves the two-dimensional overland flow equations coupled with one-dimensional open channel flow equations and includes interfaces between these two flow regimes using source and sink term approximations. It is one of the first general purpose computational solutions to a two dimensional formulation of the Navier-Stokes equations. The model is capable of approximating such hydraulic effects as backwater, drawdown, channel overflow, storage, and ponding, among other hydraulic topics of interest.

The application of legacy hydraulic models, including DHM, for large-scale applications on modern computers is constrained by multiple factors. One is related to recompiling the code to take into account new processors and architecture. Porting the Fortran 77 codes to the new computing platforms and recompiling them can be a challenge and may warrant rewriting some coding statements that are not supported by the new compilers. Changes to the legacy codes may require adding new functionalities. In this case, the DHM code was re-compiled using the Intel visual Fortran compiler. The end windows environment executable file is robust, and the time required to run the model, because of the various optimization modules in the compiler, has been significantly reduced. Another factor is that DHM was written when memory requirements in computers were limited. This limitation translated to using a smaller size of the arrays, and hence its application over large-scale computational domains was not feasible. To address this, the legacy codes can be modified to include the array standards that were introduced to Fortran in the 2000’s timeframe. The size of the dimension array in the DHM was increased from 250 to 9999. Larger arrays are possible as well. Similarly, for codes in which the system of equations is assembled into the matrix form Ax=B, the solver phase can incur a large cost. Matrices are often so large that the standard numerical methods become unsatisfactory and cannot be implemented on even high-performance computers. In a typical code, the largest portion of CPU time is spent in solving systems of linear algebraic equations [4]. It is noted that for an applied researcher, a solution module merely represents a means to an end of solving the flow equations, while for a “solver” developer, the application is a source of sparse equations to be solved. In such cases, using an appropriate solver coupled with a pre-conditioner can make the legacy codes more computationally efficient.

In this work, the results from DHM are compared with those of HEC-RAS (ver. 5.07) for a flow scenario accompanied by a flood. Our primary goal is to underscore the reliability of DHM.

Overview of the Models

DHM was developed for the USGS in the late 1970’s and is one of the first computational hydraulics programs. It solves the simplified Navier-Stokes equations written in diffusion form. For the uniform grid elements, the integrated finite difference version of the nodal domain integration method is used for solving the equations. Characteristic features of the DHM include (a) computational domain is made of square cells; (b) flow can enter or leave the cell through any of the four interfaces (c) minimum and maximum time step size that can be used in the computation needs to be specified, and (d) flow variables are calculated at the center of the cell. The required input conditions at the center of each cell are bottom elevation, initial water depth, and roughness value; The model uses an integrated finite difference numeric scheme for solving the flow equations. The model’s companion website www.diffusionhydrodynamicmodel.com has the relevant source codes, executable files, and complete documentation along with the results from various case studies of applications.

HEC-RAS allows the user to perform one-dimensional steady flow, one and two-dimensional unsteady flow calculations, sediment transport, and water quality modeling [4]. It gives the option of either solving the two dimensional diffusion wave (default mode) or the full dynamic equations. HEC-RAS and DHM share many similarities in that both models calculate the flow variables at the center of the computational cell with the given input details at the center of the cell (elevation, roughness value, initial depth). HEC-RAS uses an implicit finite volume solution of the flow equations. The model provides the flexibility of generating either uniform square, hexagonal, or adaptive mesh, based on the terrain characteristics. It also offers many other features for solving one and two dimensional steady and unsteady river flow simulations like coupling one and two dimensional models, computational mesh development and refinement tools, geometric and hydraulic input and output tools, multiple boundary options, moving sediment and water quality analysis tools, and other options as discussed in the current version of the HEC-RAS user manual [4].

Case Study Test Problem and Flow Details

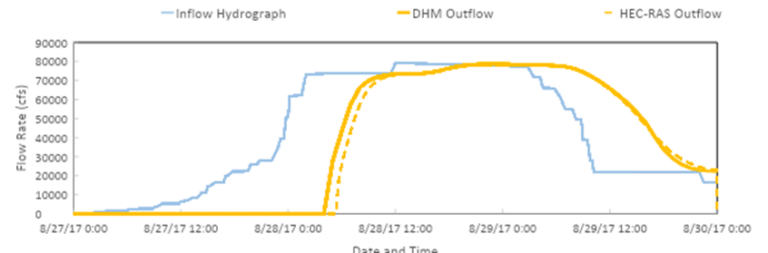
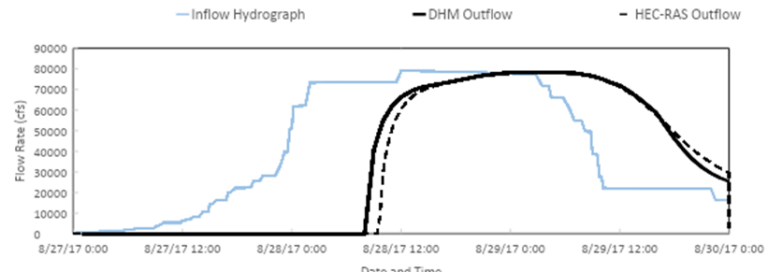
In the case under study, a rectangular channel is specified that is 41 miles long and 800ft wide with a longitudinal slope of 2.48%. The computational domain is discretized using uniform square cells of dimensions 160ft x 160ft. There are a total of 9471 cells defined in the test model domain. The two channel “walls” defined by the DHM were modeled by cells with high bottom elevations. The simulation was performed over 73 hours. An initial water depth of 0ft in all the cells was specified. The inflow hydrograph (Figure 1) was specified at the center cell of the upstream end. The inflow has a peak value of 79141 cfs at time = 36 hours and a flow of 16500 cfs at time = 72 hours. A critical depth boundary condition was specified along the downstream boundary nodes. Of interest is the cumulative outflow at the downstream boundary.

Computational Results

Figure 1 plots the inflow hydrograph and the two outflow hydrographs for a channel bottom Mannings roughness (n) value of 0.035. The peak outflow and its time of arrival, which are of primary interest in the analysis, are similar for both the configured models. The program’s default values (like tolerance variables, time step, threshold values, etc.) were used, and no effort was made to optimize them.

Figure 1. Inflow and Outflow hydrographs for n = 0.035

Figure 2 plots the corresponding outflow hydrographs for a channel bottom roughness (n) value of 0.06.

Figure 2. Inflow and Outflow hydrographs for n = 0.06

The demonstration problems show that the considered two computational models can produce very similar outcomes. This is an important result because the two models differ in their underpinnings. The respective partial differential equations being modeled differ, and the computational efforts also differ, causing a difference between the two modeling outcomes. However, the computational effort needed to use the HEC-RAS model is substantially more than the DHM formulation, which calls into question the use of the HEC-RAS in similar practical problems. It is noted that a recent advance in the DHM is a code that runs on a hand-held calculator.

Conclusions

In this effort, the performance characteristics of two well-known hydraulic models, HEC-RAS and DHM are analyzed. The focus was on comparing their respective solution of the two dimensional diffusion flow equation. Given that the Diffusive Wave formulation of the flow equations is the HEC-RAS default option, and the Diffusive Wave formulation is also the default flow routing option in the legacy program DHM, a unique opportunity exists to test both computational programs and compare outcomes. The reliability of DHM, being one of the first computational models for solving the simplified overland flow equations, was reinforced by comparing its output with the HEC-RAS output. It is concluded that other computational outcomes from legacy models like DHM can act as a baseline analysis for new computational models and paradigms that continue to evolve.

Author Details

Hromadka & Associates’ Principal and Founder, Theodore Hromadka II, Ph.D., Ph.D., Ph.D., PH, PE, has extensive scientific, engineering, expert witness, and litigation support experience. His frequently referenced scientific contributions to the hydrologic, earth, and atmospheric sciences have been widely published in peer-reviewed scientific literature, including 30 books and more than 500 scientific papers, book chapters, and government reports. His professional engineering experience includes supervision and development of over 1500 engineering studies. He is currently a faculty member at the United States Military Academy at West Point, New York.

Prasada Rao is a Professor in the Civil and Environmental Engineering Department at California State University, Fullerton.


References

1. Hromadka II TV, Yen CC. A diffusion hydrodynamic model. Water resources investigations report. U.S. geological survey; 1987: 87– 4137, https://pubs.er.usgs.gov/publication/wri874137

2. O’Brien JS, Julien PY, Fullerton WT. Two‐dimensional water flood and mudflow simulation. J Hydraulic Eng ASCE. 1993; 119: 244–261.

3. Eriksson K, Estep D, Hansbo P, and Johnson C. Computational Differential Equations. Cambridge University Press, New York, 1996.

4. Brunner, GW., CEIWR-HEC, US Army Corps of Engineers, HEC-RAS River Analysis System, 2D Modeling User’s Manual, Version 5.07, March 2021. https://www.hec.usace.army.mil/software/hec-ras/

Simulating the Water Storage Benefits of Cover Crops Using the Gridded Surface Subsurface Hydrological Analysis (GSSHA) Model

By Salam Murtada, Daniel Reinartz, and Steve Kloiber

OVERVIEW

Cover crops provide many benefits that include improving soil health, providing storage to reduce runoff, preventing soil erosion, and protecting water quality. They benefit both the environment and farm operators by optimizing the use of fertilizers, allowing runoff treatment through the unsaturated soil, and preventing the loss of nutrients to the rivers.

Cover crops are typically applied between harvest and growing seasons. They can also be interseeded with cultivated crops during the growing season. However, they have the greatest potential benefit in early spring, before planting, when the ground is otherwise fallow and soil is vulnerable to intense rainfall events.

This study compares the effects of cover crops between growing and non-growing seasons and investigates the processes that drive them, using continuous and synthetic events simulations. These processes include infiltration, surface runoff, storage capacity, and soil moisture. This paper quantifies the benefits of cover crop application in the Shakopee watershed, Minnesota through hydrological modeling using the Gridded Surface Subsurface Hydrological Analysis (GSSHA) model.

Haruna et al., 2020, summarized studies published in the last 20 years addressing the benefits of cover crop on soil physical properties. According to these studies, cover crops significantly reduced soil density and increased soil organic content leading to reductions in soil loss and surface runoff, and increases in water holding capacity, infiltration and potential carbon sequestration. In another study, Basche and DeLong, 2017, presented the benefits of cover crops and other continuous living crops in combating rainfall infiltration variability, after statistically determining their effects on increasing porosity (8.0 + 2.2%) and soil water retention at field capacity (9.3 + 2.7).

The Gridded Surface Subsurface Hydrological Analysis (GSSHA) model is a physically-based, distributive model that simulates the interactions between the complex hydrological processes taking place on the surface and subsurface media at fine temporal and spatial scales. It uses finite difference in space to the second order, and forward difference in time to the first order. The model interfaces with the Watershed Modeling System (WMS) graphical user interface. GSSHA was developed by Dr. Charles Downer of the Environmental Research and Development Center (ERDC), United States Army Corps of Engineers (USACE) and is currently supported by Aquaveo, Inc.

The Shakopee watershed (323 mi2) extends across three counties: Kandiyohi, Chippewa, and Swift counties in central Minnesota (Figure 1). It is located in predominantly agricultural areas, where corn and soybean crops comprise approximately 68% of the total watershed. The soils are primarily fine-textured and poorly drained.

Figure 1: Shakopee Creek watershed land use and location.

METHODS

In this study, the effects of cover crops on the subsurface and surface processes were simulated to evaluate changes to surface water runoff, infiltration, and evapotranspiration. After calibrating and validating the model, cover crops were introduced as a hypothetical scenario in the form of small grains applied over all agricultural areas during growing and non-growing seasons. Examples of small grains are winter-hardy cultivars of rye, wheat, and triticale that can survive cold weather. Input climate variables were held constant in the model.

Large grid cells (9.88-acre) were used to accommodate the computation time to simulate the large, 323 square-mile watershed. The model consists of three layers to represent the upper tillage layer and lower soil layers as reported by the Soil Web. Key model assumptions and parameters are summarized in Table 1.

The simulation was broken down into two connected and continuous cycles, non-growing and growing, where different processes controlled the hydrology. This enabled us to compare the effects of cover crops between the two cycles in order to highlight their benefits more accurately (Figure 2).

Figure 2: Continuous simulation broken down into three cycles where different processes dominate. Note that an increase in interception was needed for the October event to represent the late growing season just before harvest. The model interception was based on early growing season values that overestimated the observed peak and volume.

The model simulated the effects of cover crops as follows:

Hydraulic Conductivity

Hydraulic conductivity is an important factor to characterize the effects of cover crops. Based on cover crop ability to decrease soil compaction and increase the organic content of the soil within its root zone, empirical relationships from the Water Erosion Prediction Project (WEPP) method (USDA-WEPP, 1995) were used to determine the saturated hydraulic conductivity. The WEPP method combines the effects of soil properties based on the Hydrologic Soil Group (HSG) and soil texture, as well as land use features based on a specific agricultural practice (e.g. conservation tillage) or the curve number (CN). The model used the hydraulic conductivity to simulate infiltration using the Green & Ampt method. Soil textures were obtained from the Soil Survey Geographic Database (SSURGO) to compute the other parameters using Saxton & Rawls equations (2006) and Brooks & Corey equations.

Roughness

Roughness characterizes the ability of cover crops to slow water flow and create micro-storage on the surface. By increasing residency time due to roughness, cover crops increased storage and allowed more time for water to infiltrate. The model included roughness to simulate surface water flow using the Diffusive Wave equation.

Evapotranspiration (ET)

The model used the Penman-Monteith equation, where the canopy stomatal resistance and vegetation heights were adjusted to account for the effects of small grains. In addition, the evapotranspiration was adjusted seasonally in the model through a multiplier called the Canopy Resistance Amplification Factor that increased the stomatal resistance during the winter months and decreased it to 1.0 during the growing season.

Interception and Retention

These parameters were used in the late growing season to account for canopy effects in intercepting rain and retaining it on the surface.

RESULTS AND DISCUSSION

Runoff volume reduction

According to this study, the application of cover crops reduced discharge volume at the watershed outlet by an average of 11% and 41% for growing and non-growing seasons, respectively (Figure 3). Cover crop applications achieved maximum benefits during the non-growing season after they were compared with fallow ground conditions. This was attributed primarily to increases in the saturated hydraulic conductivity and roughness by 2 and 3 times, respectively. In the growing season, however, the cover crops were competing with the cultivated crops, showing improvements based on hydraulic conductivity, but not necessarily roughness. As a result, surface runoff reduction due to cover crop application was higher for the non-growing season than the growing season by a factor of 3.6 (Figure 3). Furthermore, the rate of infiltration increase due to cover crop application was higher for the non-growing season by a factor of 4.7 (Figure 3).

Figure 3: Comparing the benefits of crop cover for non-growing versus growing seasons.

Effects of cover crops on storage

According to the model results, extensive cover crop application removed an average of approximately 17,500 acre-feet of runoff volume computed at the watershed outlet (Figure 4) (equal to approximately 1-inch of runoff over the watershed) during the non-growing season. Most of the net volume removed infiltrated through the soil during the fall and early spring when the ground was not frozen. Water storage was spatially distributed across the landscape, yielding significant cumulative benefits at the watershed outlet (Figure 5).

Figure 4: Effects of cover crops on net storage and infiltration volumes for the non-growing cycle.
Figure 5: Watershed showing net gain in infiltration for most areas.

Peak flow and discharge volume sensitivity to model parameters

The simulation for the non-growing period was broken down further into separate simulations to investigate the influence of different model parameters on both peak flows and the discharge volume. Model parameters for hydraulic conductivity and roughness were analyzed independently using synthetic rainfall events. The results showed that peak flow was reduced by 30% from the combined effects of roughness and hydraulic conductivity. Discharge volume was reduced by 24%, but the relative importance and the interaction between hydraulic conductivity and roughness were different. Hydraulic conductivity and roughness were both important in reducing the volume of discharge when considered separately. However, their effects did not combine as they did for peak flow reduction. For peak flow reduction, the rate of infiltration alone is overwhelmed by the rate of precipitation. However, an increase in roughness would help slow the flow and give it more residence time for infiltration to occur. For volume reduction, both parameters are as important independently and in combination, because they affect storage on the surface as well as the subsurface in the form of recharge into the groundwater or plant uptake. In the end, the total volume at the watershed outlet will also include infiltrated flows that will ultimately exfiltrate into the stream network as groundwater baseflow.

Conclusion

Using the GSSHA model, this study quantified and characterized the water storage benefits of cover crop application for reducing both peak flow and volume discharge. It highlights the importance of cover crops as a potential tool for flood mitigation and watershed management.

The results of the analysis presented here show that the hydrologic benefits of cover crops are particularly important for the non-growing season. Cover crop applications in the non-growing season produced significant reductions in discharge volume of up to 41% when compared to fallow ground conditions. The GSSHA simulation also demonstrated volume reductions up to 11% in discharge volume for the growing season.

Both saturated hydraulic conductivity and surface roughness were the main drivers in controlling the peak flow and volume of discharge reductions, according to the simulation. Their combined effects amplified peak flow reductions.

Author Details

Salam Murtada is a civil and environmental engineer working as floodplain hydrologist for the Minnesota Department of Natural Resources. His job includes developing and reviewing hydrological and hydraulic models for watershed studies, FEMA and flood related projects, and geomorphic evaluation of culvert designs and stream restoration projects. He graduated from West Virginia University with a Master of Science degree in Civil and Environmental Engineering, and from the University of Texas at Austin in Bachelor of Science degrees in Civil Engineering and Petroleum Engineering.

Daniel Reinartz has worked for the Lake Ecology Unit of the Minnesota Department of Natural Resources for the past 9 years. He retired from the U.S. Army Corps of Engineers as a Hydrologic Engineer after 35 years. He has a total of 49 years in civil engineering with a BCE Degree from the University of Minnesota.

Steve Kloiber supervises the Lake Ecology Unit of the Minnesota Department of Natural Resources. He has over 30 years of experience in water resource science and environmental analysis. He received his masters and PhD from the University of Minnesota in environmental engineering with a minor in water resources science.

References

  1. Agricultural Research Science. (2009) Soil Water Characteristics (SWC). USDA.
  2. Agricultural Research Service. (1995). Water Erosion Prediction Project (WEPP). Chapter 7, Soil Component.
  3. Basche, A. D., DeLonge, M. (2017). The Impact of Continuous Living Cover on Soil Hydrologic Properties: A Meta-Analysis. Agronomy & Horticulture, Faculty Publications.
  4. Downer, C. W., Ogden, F. L., Byrd, A. R. (2008). GSSHAWIKI User’s Manual, Gridded Surface Subsurface Analysis Version 7.13 for WMA 10.1. ERDC Technical Report. Engineer Research and Development Center, Vicksburg, Mississippi.
  5. Haruna, S., Anderson, S. H., Udawatta, R. P., Gantzer, C. J., Phillips, N. C., Cui, S., Gao, Y. (2020). Improving soil physical properties through the use of cover crops: A review. Agrosystems, Geosciences & Environment.
  6. Singer, J., Kaspar, T., Pederson, P. (2005). Small Grains Cover Crops for Corn and Soybean. Iowa State University Extension and Outreach.
  7. Minnesota Geospatial Commons. (2013). https://gisdata.mn.gov/dataset/quick-layers
  8. US Army Corps of Engineers. HEC-DSSVue Version 1.2. (2006).
  9. University of Minnesota Extension. (2021). Cover Crops. https://extension.umn.edu/soil-and-water/cover-crops